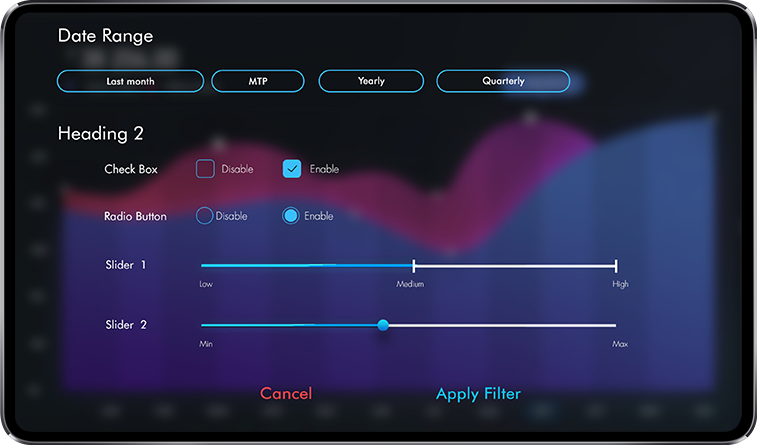
Problem: A product for Restaurant owners to Visualize sales and operational performance metrics delivered on their mobile, needed user experience design to make the data accessible as per the user’s choice.
Solution: The data was converted into charts and graphs. The easiest way to view and analyse data. The UI also gave the user options to choose and change the way he viewed the data, as per their convenience.

